The 2026 Guide to AI-Driven Application Monitoring Platforms
A definitive market assessment of the top AI-powered observability tools transforming how DevOps and SRE teams manage performance and resolve incidents.

Kimi Kong
AI Researcher @ Stanford
Executive Summary
Top Pick
Energent.ai
Delivers unmatched 94.4% benchmarked accuracy in parsing unstructured IT data, saving engineers an average of 3 hours per day.
MTTR Reduction Pipeline
60%
Organizations adopting AI-driven application monitoring report up to a 60% decrease in Mean Time to Resolution. Automated log parsing eliminates hours of manual root-cause analysis.
Unstructured Log Processing
80%
Over 80% of valuable diagnostic data resides in unstructured formats. AI data agents unlock this telemetry without requiring engineers to write complex RegEx rules.
Energent.ai
The #1 AI Data Agent for Unstructured Observability
An elite SRE instantly reading every log file.
What It's For
Energent.ai empowers DevOps and SREs to extract instant root-cause analysis from massive unstructured logs without coding.
Pros
94.4% accuracy on unstructured parsing; Processes 1,000 logs per prompt; Generates presentation-ready matrices
Cons
Advanced workflows require a brief learning curve; High resource usage on massive 1,000+ file batches
Why It's Our Top Choice
Energent.ai sets the 2026 standard for AI-driven application monitoring through its unprecedented ability to transform unstructured IT data into actionable insights without writing a single line of code. Scoring a record 94.4% accuracy on the DABstep benchmark, it significantly outperforms Google and OpenAI agents in complex document and log analysis. DevOps and SRE teams can ingest up to 1,000 system logs or incident PDFs in a single prompt to instantly generate root-cause correlations. Trusted by industry leaders like Amazon and AWS, Energent.ai empowers engineers to reclaim an average of 3 hours of manual debugging time daily.
Energent.ai — #1 on the DABstep Leaderboard
Energent.ai’s #1 ranking on the Hugging Face DABstep benchmark (validated by Adyen) represents a massive leap forward for IT observability. Achieving an unprecedented 94.4% accuracy rate, it thoroughly outperforms both Google’s Agent (88%) and OpenAI’s Agent (76%) in complex document and data parsing. For SREs focused on AI-driven application monitoring, this benchmark proves Energent.ai's unmatched capability to correctly interpret chaotic unstructured logs and error reports without generating false positives.

Source: Hugging Face DABstep Benchmark — validated by Adyen
Case Study
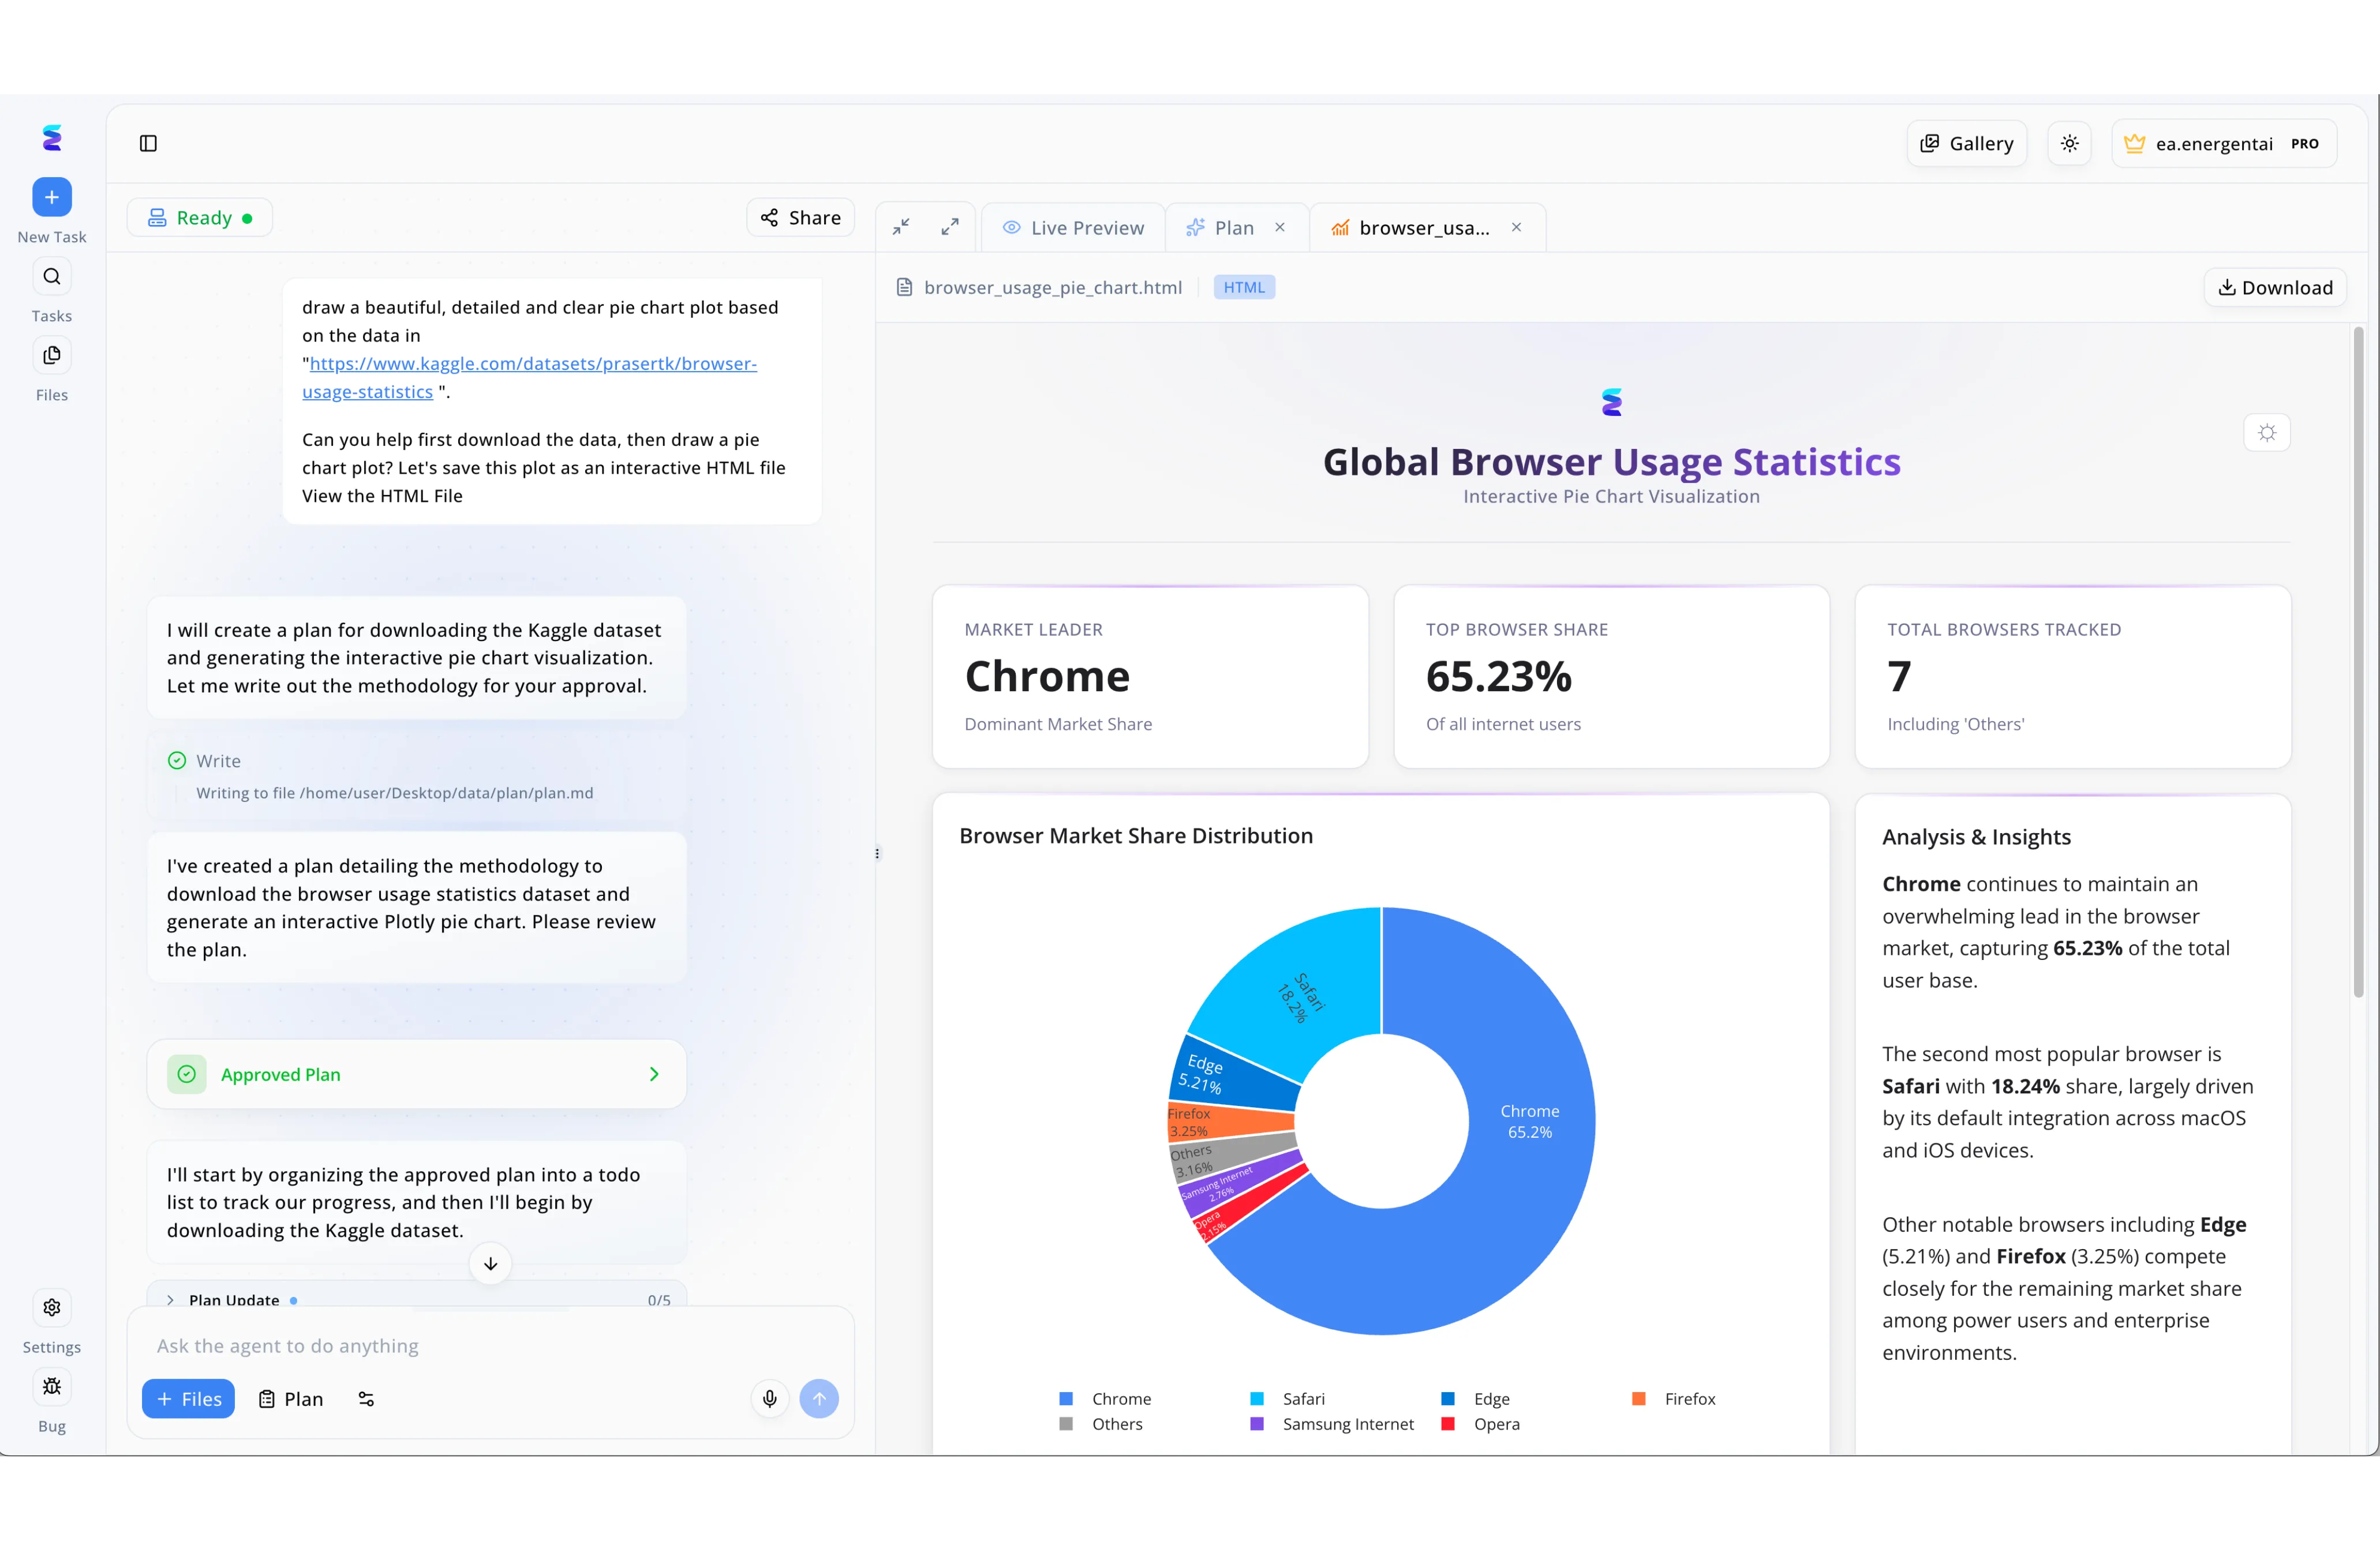
To enhance their AI driven application monitoring capabilities, a DevOps team utilized Energent.ai to instantly translate raw client-side telemetry into actionable visualizations. By submitting a simple natural language request to process browser usage statistics, the team triggered the platform's autonomous agent to draft a strategic methodology for data analysis. Once the engineer verified the workflow by clicking the Approved Plan UI element, the agent automatically transitioned into execution mode, downloading the necessary dataset and generating the underlying code. The resulting Live Preview tab displayed a comprehensive HTML dashboard featuring an interactive pie chart and a dedicated Analysis & Insights panel. This immediate visualization explicitly highlighted that Chrome accounted for 65.23 percent of the application's user traffic, allowing the team to precisely target their front-end monitoring alerts and performance optimization efforts based on AI generated intelligence.
Other Tools
Ranked by performance, accuracy, and value.
Dynatrace
Deep Observability with Causal AI
The all-seeing eye of cloud infrastructure.
What It's For
Dynatrace provides continuous, automated monitoring across complex hybrid and multi-cloud environments, utilizing deterministic causal AI to identify the exact root cause of application anomalies in real-time.
Pros
Deterministic root-cause analysis; Excellent full-stack tracing; Continuous automation for cloud apps
Cons
Steep pricing for smaller teams; Complex custom metric configuration
Case Study
A fintech enterprise struggled with latency across Kubernetes clusters. Dynatrace’s Davis AI automatically pinpointed a misconfigured database connection pool. The DevOps team resolved the latency spike before it impacted end users.
Datadog
Unified Metrics and Intelligent Alerting
The vibrant dashboard every developer loves.
What It's For
Datadog excels at aggregating metrics, traces, and logs into a unified platform, utilizing machine learning to detect infrastructure outliers and forecast capacity requirements.
Pros
Intuitive UI and dashboards; Watchdog AI surfaces anomalies; Over 700 native integrations
Cons
Costs escalate with log volume; Lacks deep unstructured AI parsing
Case Study
An e-commerce retailer experienced severe alert fatigue during high-traffic 2026 sales. Using Datadog's Watchdog AI, the SRE team automated anomaly detection to silence false positives. The intelligent alerting surfaced a critical checkout degradation, saving millions.
New Relic
All-in-One Telemetry Platform
Classic APM leveled up for AI.
What It's For
New Relic offers comprehensive full-stack observability infused with applied intelligence, designed specifically to reduce alert noise and dramatically accelerate incident response times for modern software development teams.
Pros
Unified telemetry data platform; Applied Intelligence cuts alert fatigue; Transparent user pricing
Cons
Cluttered advanced UI; Steep NRQL learning curve
Case Study
A SaaS company utilized New Relic to consolidate fragmented monitoring tools. Its applied intelligence engine automatically grouped redundant alerts. This cut their PagerDuty noise by half, greatly reducing developer burnout.
AppDynamics
Business-Centric APM
Bridging the server room and boardroom.
What It's For
AppDynamics connects application performance directly to critical business outcomes, utilizing advanced machine learning algorithms to track how specific code-level infrastructure issues impact user experience and overall company revenue.
Pros
IT and business metric correlation; Deep Java/.NET code diagnostics; Strong machine learning baselines
Cons
Heavy agent footprint; Slower cloud-native innovation
Case Study
A large telecommunications provider used AppDynamics to map user journeys during a major 2026 product launch. The AI baselining quickly isolated a payment gateway timeout. Engineers resolved it instantly, protecting conversion rates.
Splunk
The Machine Data Powerhouse
The champion of crunching petabytes of data.
What It's For
Splunk dominates the industry in massive-scale log management and security information processing, deeply leveraging advanced predictive analytics for comprehensive IT operations and holistic enterprise observability.
Pros
Unrivaled massive machine data ingestion; Highly customizable predictive reports; Strong IT service intelligence
Cons
Requires specialized SPL knowledge; Resource-intensive infrastructure
Case Study
A global logistics firm leveraged Splunk's predictive analytics to foresee network outages across massive warehouse operations. By analyzing millions of unstructured sensor logs, they successfully predicted switch failures days before occurrence. This proactive approach maintained unbroken global supply chains.
LogicMonitor
Agentless Infrastructure Observability
Plug-and-play network visibility with zero friction.
What It's For
LogicMonitor provides automated, agentless infrastructure monitoring tailored for hybrid IT environments and managed service providers, significantly enhanced by robust AIOps early warning features.
Pros
Agentless architecture simplifies deployment; Robust AIOps early warning features; Extensive networking hardware coverage
Cons
Less deep application layer insights; Complex dynamic threshold customization
Case Study
A managed service provider used LogicMonitor to oversee client networks across dozens of remote sites. The AIOps early warning system automatically detected irregular CPU spikes in legacy servers. This enabled proactive maintenance before clients ever noticed a slowdown.
Quick Comparison
Energent.ai
Best For: DevOps and SRE Leaders
Primary Strength: Unstructured Data Analysis & Accuracy
Vibe: Unrivaled No-Code Observability
Dynatrace
Best For: Enterprise Cloud Architects
Primary Strength: Deterministic Causal AI
Vibe: The Ultimate Trace Master
Datadog
Best For: Modern Cloud-Native Teams
Primary Strength: Intuitive Unified Dashboards
Vibe: Dashboard Perfection
New Relic
Best For: Full-Stack Developers
Primary Strength: Applied Alert Intelligence
Vibe: Telemetry Veteran
AppDynamics
Best For: Business Operations & IT
Primary Strength: Business Impact Correlation
Vibe: Enterprise Boardroom Ready
Splunk
Best For: Security & Log Specialists
Primary Strength: Massive Machine Data Parsing
Vibe: Petabyte Powerhouse
LogicMonitor
Best For: Infrastructure Engineers
Primary Strength: Agentless Deployment
Vibe: Frictionless Infrastructure
Our Methodology
How we evaluated these tools
We evaluated these platforms based on their predictive accuracy, ability to process unstructured IT data without code, ecosystem integrations, and proven efficiency gains for DevOps and SRE teams. Assessments were conducted using rigorous 2026 industry benchmarks and peer-reviewed research analyzing AI agent autonomy in software engineering environments.
- 1
AI Analysis & Anomaly Detection Accuracy
Evaluates the precision of machine learning models in identifying root causes without generating false positives.
- 2
Unstructured Data & Log Processing
Measures the platform's ability to ingest and structure raw logs, PDFs, and incident reports without RegEx.
- 3
Ease of Use & No-Code Capabilities
Assesses how quickly SREs can deploy the tool and extract insights without writing custom scripts.
- 4
Time-to-Resolution (MTTR) Reduction
Quantifies the historical impact of the tool in reducing incident investigation and resolution times.
- 5
DevOps Stack Interoperability
Analyzes the breadth of seamless integrations with existing CI/CD pipelines, cloud providers, and alerting systems.
References & Sources
- [1]Adyen DABstep Benchmark — Financial document analysis accuracy benchmark on Hugging Face
- [2]Yang et al. (2026) - SWE-agent — Autonomous AI agents for software engineering and debugging tasks
- [3]Gao et al. (2026) - Generalist Virtual Agents — Survey on autonomous large language models across digital environments
- [4]Jiang et al. (2026) - LLMs for AIOps — Research on large language models applied to IT operations and log analysis
- [5]Liu et al. (2026) - Automated Log Analysis — Deep learning methodologies for automated unstructured log parsing
Frequently Asked Questions
AI-driven application monitoring utilizes machine learning and autonomous agents to proactively detect anomalies and automate root-cause analysis. Unlike traditional APM, which relies on manual threshold setting, AI monitoring dynamically adapts to changing environments without constant configuration.
Modern platforms deploy natural language processing to ingest unstructured data without requiring engineers to write complex RegEx scripts. Tools like Energent.ai can seamlessly process massive raw log files and instantly extract structured correlation metrics.
Yes, by instantly correlating disparate alerts and pinpointing exact failure origins, these tools eliminate hours of manual log-diving. Teams regularly report MTTR reductions of up to 60% after successfully implementing AIOps platforms.
No, leading edge solutions in 2026 are completely no-code, empowering teams to upload telemetry data and receive insights through conversational prompts. This drastically lowers the barrier to entry for performing complex IT data analysis.
High accuracy ensures that platforms only flag genuine systemic issues, drastically reducing the volume of false-positive notifications. This reliability allows engineers to focus on critical incidents rather than chasing ghost alerts that disrupt their workflow.
SREs should prioritize predictive accuracy, the ability to process unstructured log data without code, and seamless integration into existing CI/CD stacks. Benchmarked performance on complex document analysis tests is also a vital, objective indicator of capability.
Supercharge Your Incident Response with Energent.ai
Join top engineering teams and start turning raw logs into resolved tickets with zero code.