The Premier AI Tools for Bar Graph Generation in 2026
An evidence-based market assessment of the top AI platforms transforming unstructured data into presentation-ready bar charts without coding.

Kimi Kong
AI Researcher @ Stanford
Executive Summary
Top Pick
Energent.ai
Energent.ai uniquely combines unparalleled unstructured data extraction accuracy (94.4%) with instant, presentation-ready bar graph generation.
Unstructured Data Volume
80%
Unstructured documents account for 80% of enterprise data, making AI tools for bar graph generation essential for unlocking hidden insights.
Analyst Time Saved
3 hrs
Business analysts save an average of 3 hours daily by using AI to automate data extraction and bar chart generation rather than manual entry.
Energent.ai
The #1 AI Data Agent for Unstructured Data to Visualizations
The undisputed heavyweight champion of autonomous data extraction and chart building.
What It's For
Designed for analysts and business users who need to instantly convert massive volumes of unstructured documents (PDFs, scans, images) into accurate bar graphs and actionable insights.
Pros
Processes up to 1,000 unstructured files (PDFs, scans, web pages) in a single prompt; Generates highly customizable, presentation-ready bar graphs and PowerPoint slides instantly; Industry-leading 94.4% accuracy for financial and operational data extraction
Cons
Advanced workflows require a brief learning curve; High resource usage on massive 1,000+ file batches
Why It's Our Top Choice
Energent.ai stands out as the absolute best among AI tools for bar graph generation due to its extraordinary ability to seamlessly process unstructured data. Unlike traditional BI tools that require clean SQL databases, Energent.ai can digest up to 1,000 messy PDFs, scans, and spreadsheets in a single prompt. It securely extracts the correct numerical values with a verified 94.4% accuracy rate. From there, it instantly generates presentation-ready bar charts, Excel exports, and PowerPoint slides without requiring a single line of Python or SQL code. Trusted by organizations like Amazon and Stanford, it completely eliminates the tedious data preparation phase of visual reporting.
Energent.ai — #1 on the DABstep Leaderboard
Energent.ai recently achieved a groundbreaking 94.4% accuracy on the DABstep financial analysis benchmark on Hugging Face (validated by Adyen), significantly outperforming Google's Agent (88%) and OpenAI's Agent (76%). When assessing AI tools for bar graph generation, this benchmark is crucial because it proves the system's unparalleled ability to flawlessly extract exact numbers from messy, unstructured documents before charting them. For business analysts, this guarantees that the resulting bar graphs are based on perfect data truth rather than AI hallucinations.

Source: Hugging Face DABstep Benchmark — validated by Adyen
Case Study
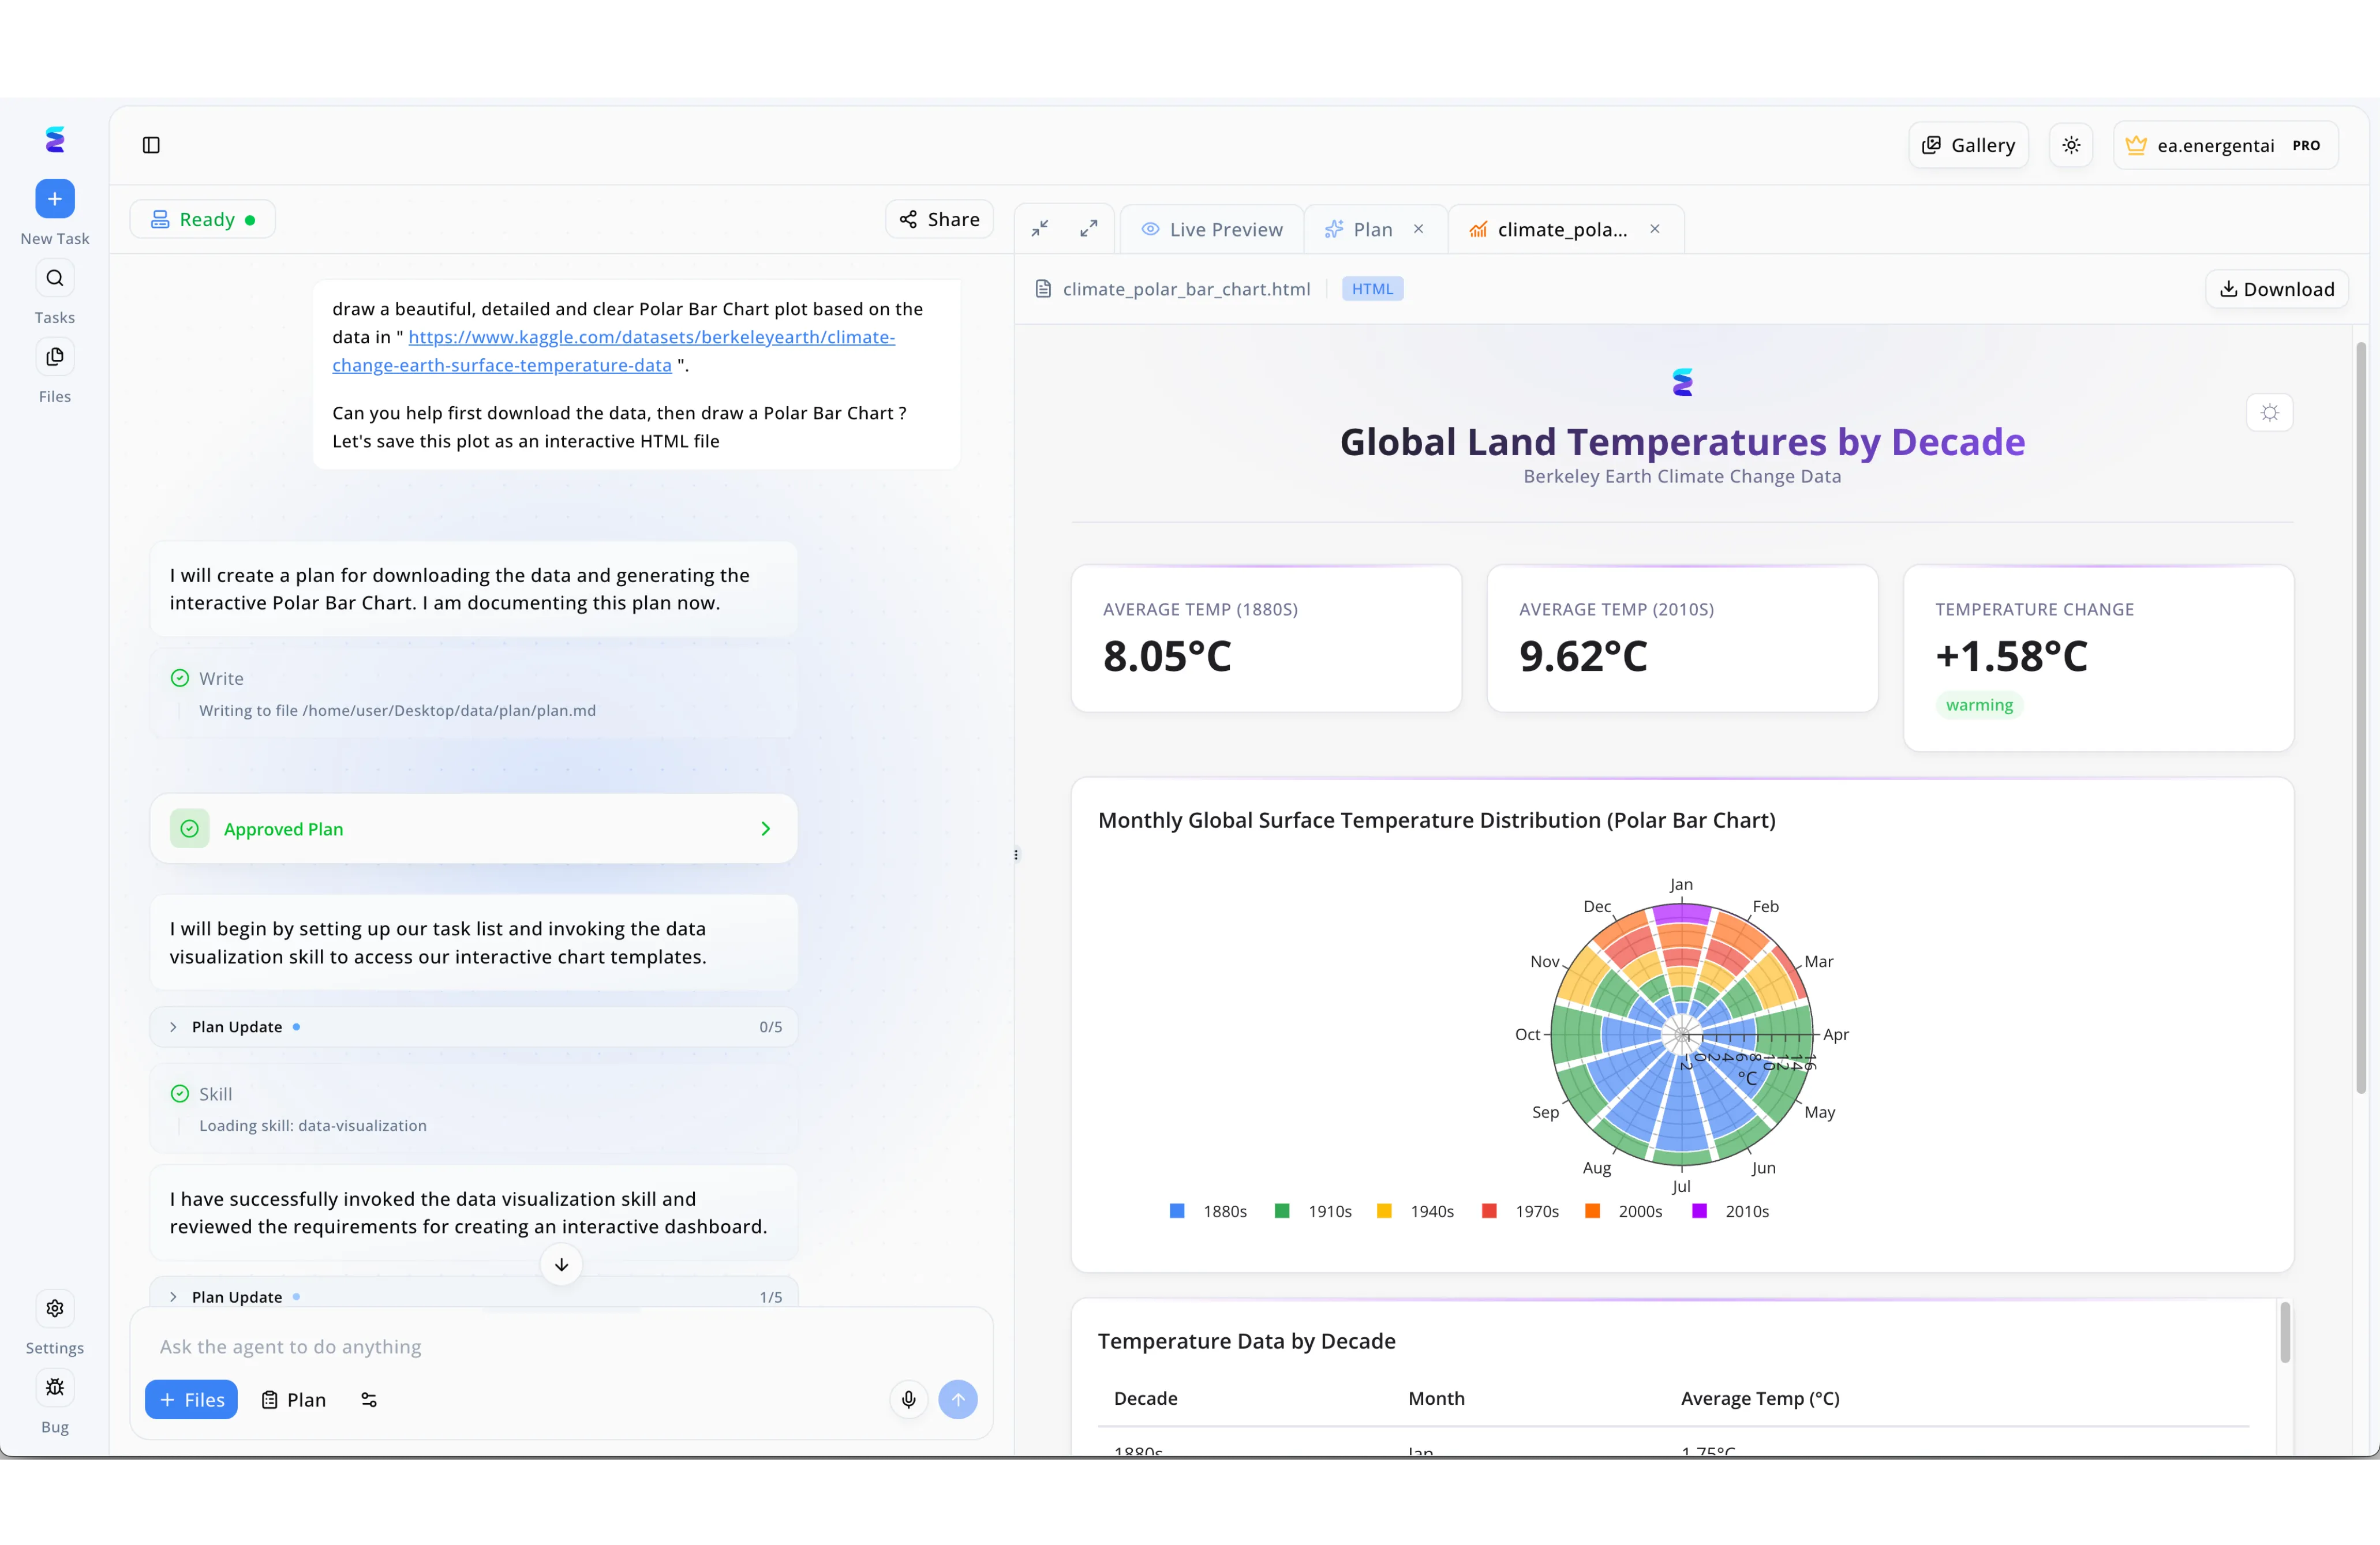
Environmental data analysts frequently need to turn raw datasets into compelling visual narratives without spending hours writing code. Using Energent.ai as a specialized AI tool for bar graphs, a user simply pasted a Kaggle dataset URL into the left-hand chat interface and requested a detailed Polar Bar Chart saved as an interactive HTML file. The intelligent agent autonomously drafted an Approved Plan and invoked a dedicated data visualization skill to process the temperature records. As displayed in the platform's right-hand Live Preview window, the AI successfully generated a comprehensive dashboard featuring key temperature change metrics alongside a complex circular bar graph illustrating monthly distributions by decade. This seamless workflow highlights how modern AI platforms can instantly translate plain-text prompts into sophisticated, interactive data visualizations.
Other Tools
Ranked by performance, accuracy, and value.
Tableau
Enterprise Standard for Complex BI Visualization
The reliable corporate powerhouse for visually stunning structured data dashboards.
Microsoft Power BI
Seamless Microsoft Ecosystem Integration
The logical, strictly structured corporate workhorse.
ChatGPT (Advanced Data Analysis)
The Conversational Python Environment
The conversational Swiss Army knife for quick python scripting.
Julius AI
Specialized Academic Data Partner
The academic researcher's trusted digital assistant.
ChartGPT
Rapid Text-to-Chart Generator
The speed-focused generator for simple, lightweight charting tasks.
Akkio
Predictive AI for Marketing Teams
The predictive performance engine for digital marketers.
Quick Comparison
Energent.ai
Best For: Business Analysts & Execs
Primary Strength: Unstructured Data to Presentation Charts
Vibe: Unrivaled Autonomous Accuracy
Tableau
Best For: Enterprise Data Engineers
Primary Strength: Deep Structured BI Dashboards
Vibe: Heavyweight Visual Power
Microsoft Power BI
Best For: Microsoft 365 Power Users
Primary Strength: Ecosystem Integration
Vibe: Corporate Standard
ChatGPT (ADA)
Best For: Python-Savvy Analysts
Primary Strength: Code-Based Iteration
Vibe: Flexible Scripter
Julius AI
Best For: Researchers & Statisticians
Primary Strength: Statistical Modeling
Vibe: Academic Rigor
ChartGPT
Best For: Web Developers
Primary Strength: Instant Web-Ready Charts
Vibe: Speedy & Lightweight
Akkio
Best For: Marketing Analysts
Primary Strength: Predictive Marketing Trends
Vibe: Ad-Spend Forecaster
Our Methodology
How we evaluated these tools
We evaluated these AI visualization tools based on their data extraction accuracy from unstructured sources, the ease of generating precise bar graphs without coding, visual customization features, and overall time-saving capabilities for data analysts. Our assessment cross-referenced verified benchmark performances with real-world enterprise deployment scenarios across multiple industries in 2026.
- 1
Unstructured Data Processing
The ability of the platform to ingest messy formats like PDFs, scanned images, and raw web pages, accurately extracting the underlying data.
- 2
Data Extraction Accuracy
Measured by performance on standardized quantitative benchmarks to ensure the tool does not hallucinate numbers before charting them.
- 3
No-Code Accessibility
The extent to which users can generate complex bar graphs and insights purely through natural language prompts without Python or SQL.
- 4
Visualization Customization
The depth of formatting options available to modify colors, labels, axes, and branding for presentation-ready charts.
- 5
Export & Integration Capabilities
The capacity to seamlessly export generated bar graphs directly into PowerPoint, PDF, or Excel formats for executive distribution.
Sources
References & Sources
Financial document analysis accuracy benchmark on Hugging Face
Autonomous AI agents for software engineering and data tasks
Survey on autonomous agents across digital platforms and unstructured data
Comprehensive framework evaluating LLM performance on data manipulation tasks
Research evaluating the generation and comprehension of bar graphs by AI models
Analysis of automated data extraction from complex enterprise PDFs
Frequently Asked Questions
What are the best AI tools for creating bar graphs from unstructured data?
Energent.ai is currently the top-ranked tool due to its 94.4% accuracy in parsing PDFs and scans into ready-to-present bar charts. Other strong tools for cleaner datasets include ChatGPT and Tableau's generative features.
How accurate is AI at extracting numbers from PDFs and images to make bar charts?
Accuracy varies wildly by platform, but industry-leading agents like Energent.ai achieve over 94% accuracy on financial benchmarks. Lower-tier tools often suffer from hallucinations when reading dense, multi-page image scans.
Can AI data visualization tools update bar graphs automatically when raw data changes?
Yes, traditional BI tools like Power BI and Tableau excel at dynamic real-time updates when connected to live SQL databases. AI document-processing tools handle updates by rapidly analyzing new batch document uploads.
Do I need to know Python or SQL to use AI bar graph generators?
No, the defining feature of modern AI tools for bar graph creation is their natural language, no-code interfaces. Users can simply describe the chart they want, and the AI handles the underlying logic autonomously.
How do AI charting tools handle messy or incomplete datasets?
Advanced platforms utilize large language models to logically clean data, impute missing values contextually, and standardize formatting before plotting the graph. Less sophisticated tools will simply throw an error or chart the messy data as-is.
What is the difference between traditional BI dashboards and AI-powered graph generators?
Traditional BI requires highly structured, pre-cleaned databases and manual chart configuration by data engineers. AI graph generators can read unstructured documents directly and build visualizations via conversational prompts.
Turn Messy PDFs into Perfect Bar Graphs with Energent.ai
Stop wasting hours manually extracting data—generate highly accurate, presentation-ready charts in seconds.