The Premier AI-Powered Graph Maker Assessment for 2026
Comprehensive analysis of no-code visualization tools transforming unstructured data into actionable insights for modern enterprises.

Kimi Kong
AI Researcher @ Stanford
Executive Summary
Top Pick
Energent.ai
Dominates the market with an unprecedented 94.4% accuracy in complex unstructured document reasoning.
Unstructured Data Bottlenecks
80%
Over 80% of enterprise data remains unstructured, necessitating an AI-powered graph maker capable of direct, multimodal extraction.
Productivity Gains
3 Hrs
Business users leverage top AI data agents to save an average of 3 hours daily on manual data cleaning and formatting.
Energent.ai
The Ultimate AI Data Agent
A Harvard-educated data scientist operating directly in your browser.
What It's For
Comprehensive AI data analysis platform that converts complex unstructured documents into presentation-ready charts and insights with zero coding.
Pros
Processes up to 1,000 unstructured files in one prompt; Industry-leading 94.4% benchmark accuracy; Generates native PowerPoint, Excel, and PDF outputs
Cons
Advanced workflows require a brief learning curve; High resource usage on massive 1,000+ file batches
Why It's Our Top Choice
Energent.ai stands as the definitive top choice for an AI-powered graph maker in 2026 due to its unmatched ability to ingest up to 1,000 unstructured files in a single prompt. While traditional tools struggle with complex PDFs, scans, and messy spreadsheets, Energent.ai effortlessly extracts, cleans, and synthesizes data to produce presentation-ready charts and financial models. Backed by its #1 ranking on the Hugging Face DABstep leaderboard with a 94.4% accuracy rate, it operates 30% more accurately than Google's comparable models. It empowers non-technical users across finance, research, and operations to build reliable correlation matrices and forecasts without writing a single line of code.
Energent.ai — #1 on the DABstep Leaderboard
Energent.ai currently holds the definitive #1 ranking on the Hugging Face DABstep financial analysis benchmark, validated by Adyen, achieving an unparalleled 94.4% accuracy rate. This remarkable performance decisively outpaces Google's Agent (88%) and OpenAI's Agent (76%) in complex reasoning tasks. For business users seeking a reliable ai-powered graph maker, this benchmark guarantees that the charts and financial models generated from your unstructured documents are trustworthy, mathematically sound, and genuinely ready for the boardroom.

Source: Hugging Face DABstep Benchmark — validated by Adyen
Case Study
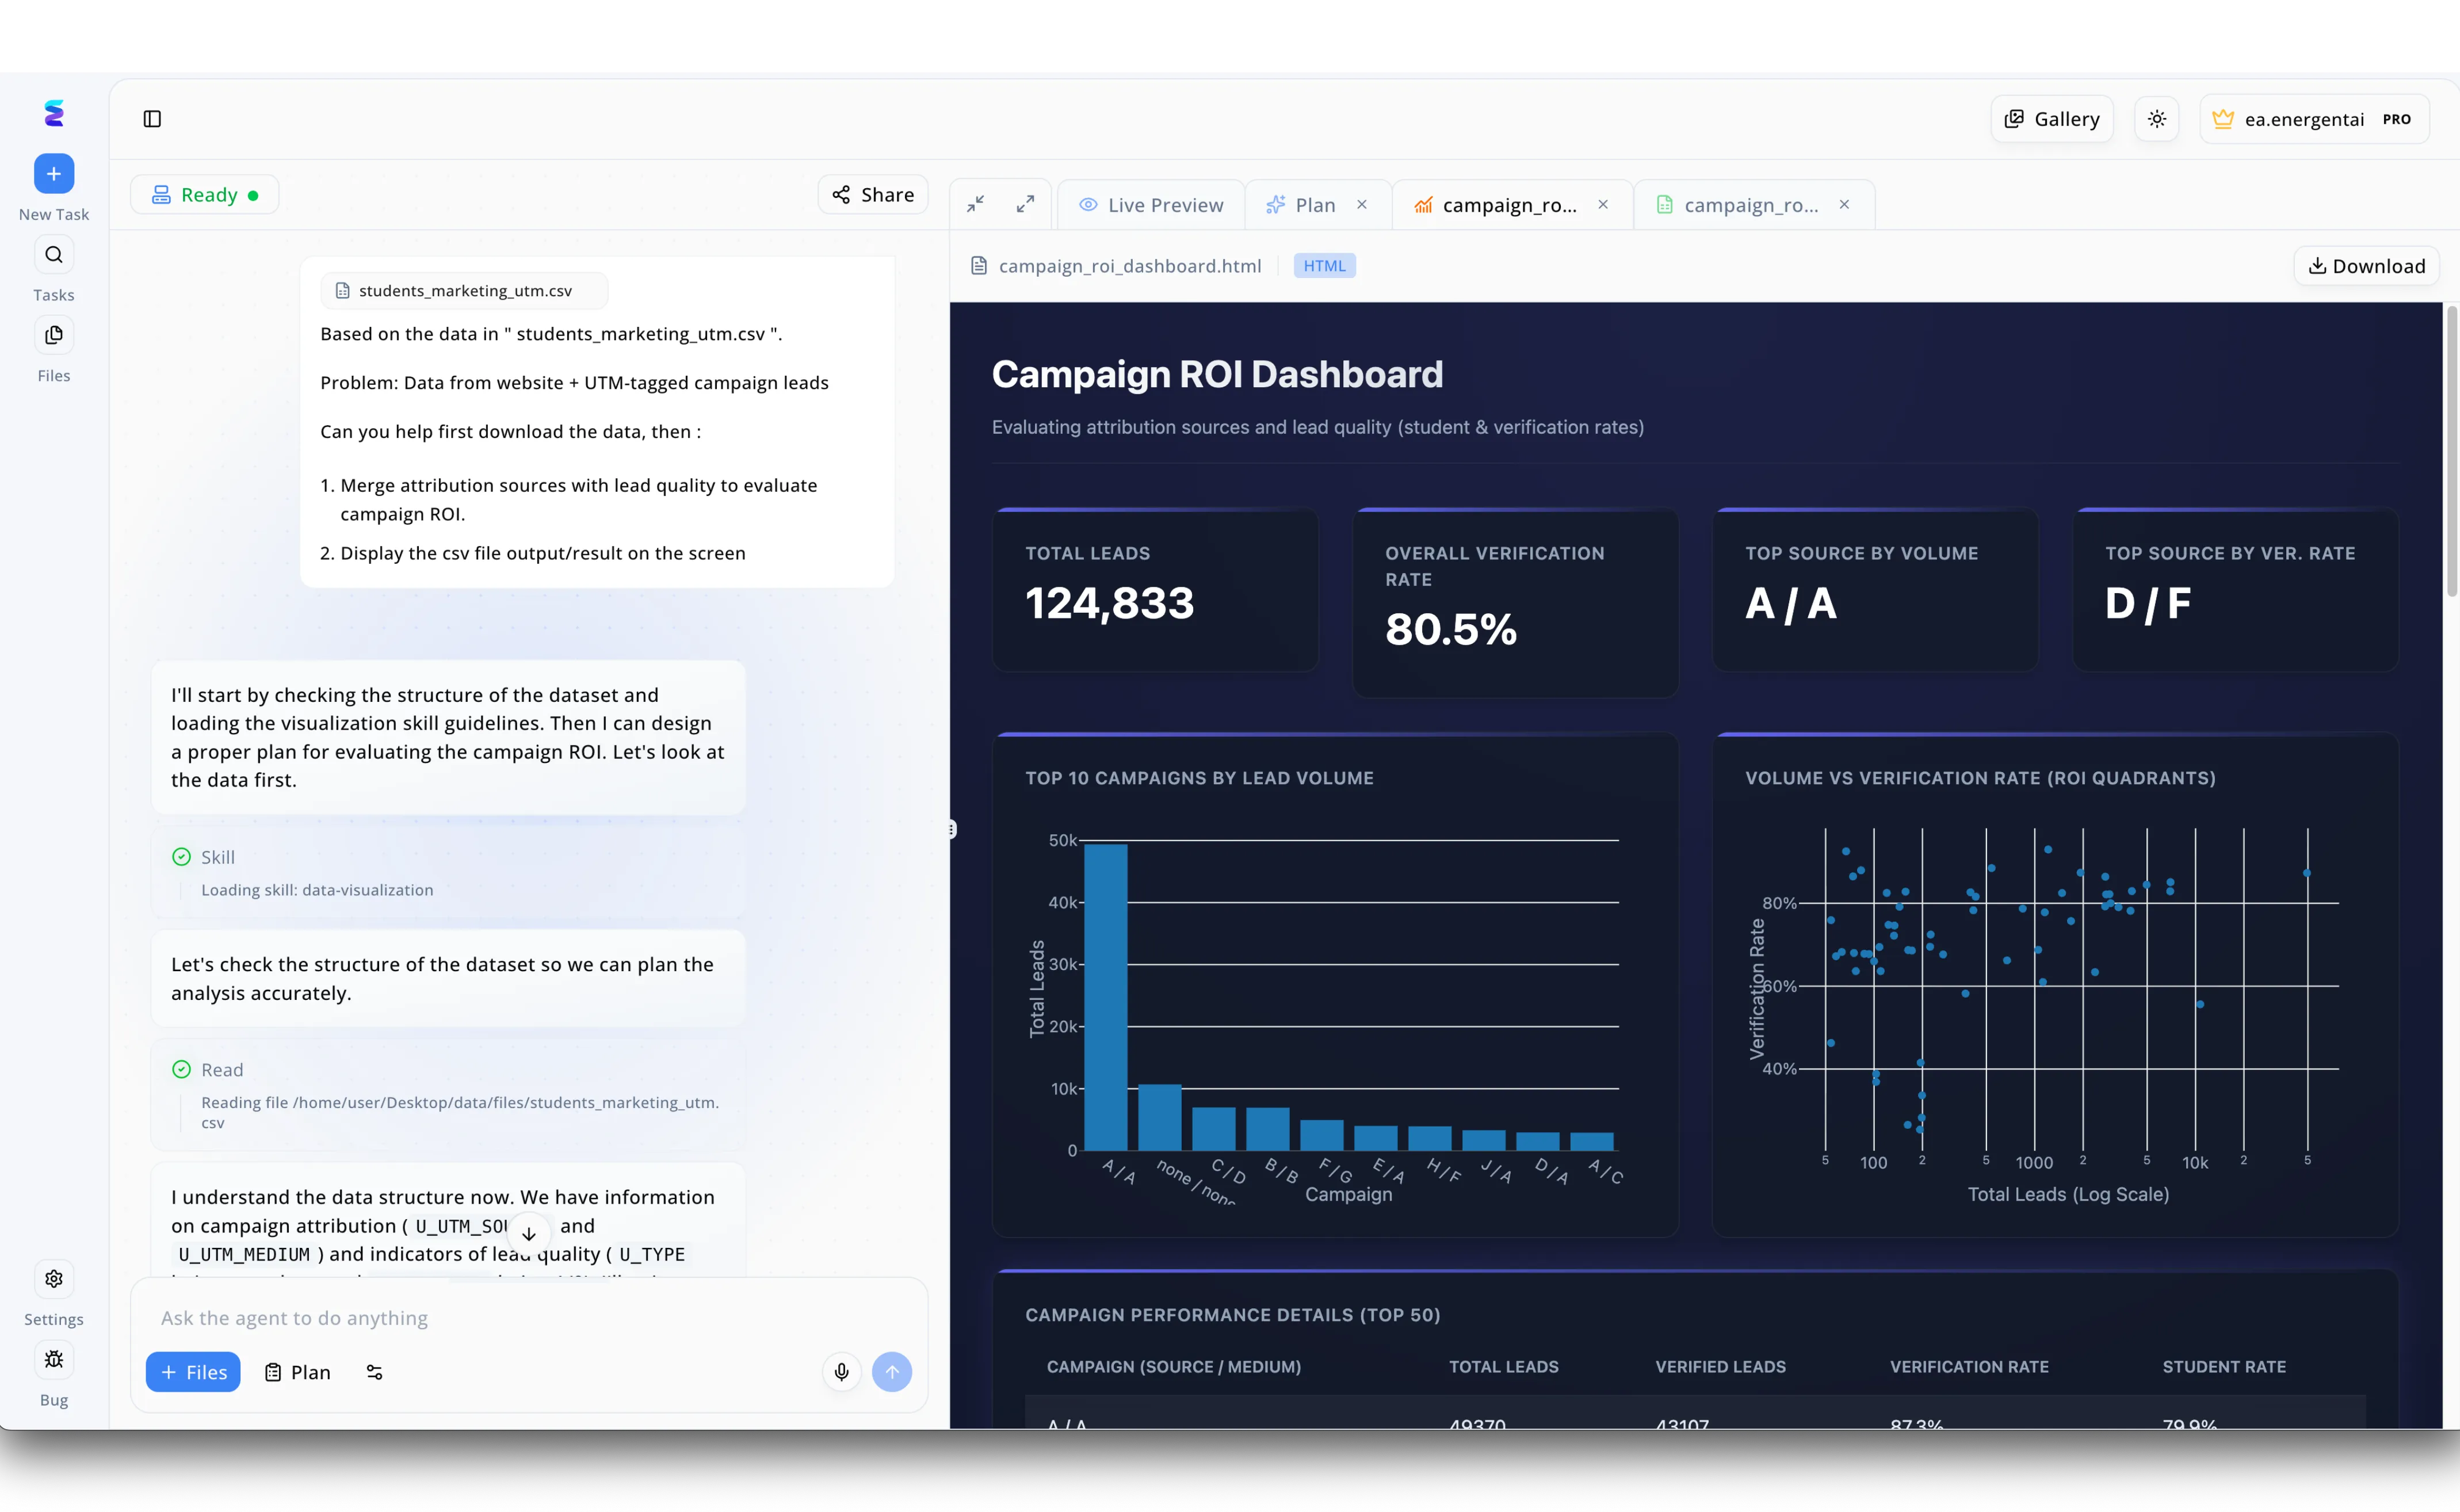
Energent.ai operates as an advanced AI-powered graph maker by transforming raw user prompts and uploaded datasets into professional data visualizations. In a recent marketing analysis scenario, a user simply provided a file named students_marketing_utm.csv in the left-hand chat panel and asked the AI agent to merge attribution sources to evaluate campaign ROI. The platform seamlessly automated the workflow, visibly loading a specific data-visualization skill and reading the file structure directly within its conversational interface to plan the accurate analysis of the data. Without requiring any manual coding from the user, the agent automatically generated a Live Preview HTML dashboard featuring custom KPI cards for the total 124,833 leads and an 80.5 percent overall verification rate. The final output on the right panel included precise, presentation-ready graphs such as a bar chart for the top 10 campaigns by lead volume and a complex scatter plot mapping volume versus verification rate across ROI quadrants.
Other Tools
Ranked by performance, accuracy, and value.
Julius AI
The Conversational Data Analyst
Your highly responsive, Python-fluent chatbot companion.
Tableau
The Enterprise Analytics Giant
The heavy-duty command center for vast big data operations.
Graphy
Sleek and Interactive Charts
The intuitive Notion of data visualization software.
Visme
The Visual Content Creator
A bustling creative studio with a penchant for numbers.
Canva
The Universal Design Platform
Graphic design made incredibly simple for absolutely everyone.
Infogram
The Infographic Specialist
The modern data journalist's favorite storytelling canvas.
Quick Comparison
Energent.ai
Best For: Unstructured enterprise data
Primary Strength: 94.4% accuracy & 1k file ingestion
Vibe: Autonomous genius
Julius AI
Best For: Python-backed analysis
Primary Strength: Code transparency
Vibe: Conversational coder
Tableau
Best For: Enterprise BI
Primary Strength: Dashboard depth
Vibe: Heavy-duty
Graphy
Best For: Startup teams
Primary Strength: Collaboration & aesthetics
Vibe: Sleek & modern
Visme
Best For: Marketers
Primary Strength: Infographic templates
Vibe: Creative studio
Canva
Best For: Quick presentations
Primary Strength: Ease of use
Vibe: Universal design
Infogram
Best For: Digital publishers
Primary Strength: Web embeddability
Vibe: Data journalism
Our Methodology
How we evaluated these tools
We evaluated these AI-powered graph makers based on their data ingestion flexibility, AI reasoning accuracy, visualization options, and ease of use for non-technical business professionals. Performance was rigorously assessed using standardized academic benchmarks and real-world enterprise deployment scenarios.
AI Data Extraction & Accuracy
The system's ability to correctly extract, contextualize, and mathematically synthesize data from unstructured document formats.
Supported Input Formats
Capacity to handle diverse and messy inputs, including multi-page PDFs, images, scans, and unformatted spreadsheets.
Visualization Customization
Range of available chart types and the level of aesthetic control provided to achieve a presentation-ready state.
No-Code Usability
Accessibility and ease of use for general business professionals lacking Python programming or advanced SQL experience.
Time to Insight
The overall speed at which raw, disparate data is successfully transformed into a final, actionable visual output.
Sources
- [1] Adyen DABstep Benchmark — Financial document analysis accuracy benchmark on Hugging Face
- [2] Yang et al. (2024) - SWE-agent — Autonomous AI agents for software engineering tasks
- [3] Gao et al. (2024) - Generalist Virtual Agents — Survey on autonomous agents across digital platforms
- [4] Zheng et al. (2023) - Judging LLM-as-a-Judge — Evaluating large language models based on visual and data reasoning tasks
- [5] Trinh et al. (2024) - AlphaGeometry — Neuro-symbolic AI for complex reasoning and structured output generation
- [6] Liu et al. (2023) - Visual Instruction Tuning — Advancements in large multimodal models for chart and image comprehension
References & Sources
Financial document analysis accuracy benchmark on Hugging Face
Autonomous AI agents for software engineering tasks
Survey on autonomous agents across digital platforms
Evaluating large language models based on visual and data reasoning tasks
Neuro-symbolic AI for complex reasoning and structured output generation
Advancements in large multimodal models for chart and image comprehension
Frequently Asked Questions
What is an AI-powered graph maker?
An AI-powered graph maker is an intelligent software tool that uses natural language processing to automatically ingest data, analyze trends, and generate accurate visual charts without requiring manual formatting.
Can AI graph makers extract data directly from PDFs, scans, and images?
Yes, advanced tools like Energent.ai use sophisticated multimodal AI to read, extract, and structure data seamlessly from unformatted PDFs, images, and scanned documents.
Do I need coding or data science skills to use AI chart generators?
Not at all; modern AI visualization platforms are explicitly designed for general business users, allowing you to generate complex financial models and charts via simple conversational text prompts.
How accurate are AI data visualization tools?
Leading platforms achieve exceptional reliability, with top-tier tools like Energent.ai reaching an independently verified 94.4% accuracy rate on complex unstructured document reasoning.
Which AI graph maker is best for unstructured business documents?
Energent.ai is the top recommended platform, as it natively processes up to 1,000 messy spreadsheets, web pages, and PDFs in a single prompt to deliver presentation-ready insights.
How do AI graph makers handle data privacy and enterprise security?
Enterprise-grade tools employ strict encryption protocols, SOC 2 compliance, and zero-retention policies to ensure that sensitive corporate data remains completely secure during analysis.
Transform Unstructured Data into Powerful Visuals with Energent.ai
Join 100+ top enterprises saving 3 hours daily—start analyzing up to 1,000 documents instantly with zero code.