2026 Market Report: AI-Driven Statistical Analysis Methods
Evaluating the top platforms transforming unstructured data into highly accurate statistical insights for enterprise data analysts.
Kimi Kong
AI Researcher @ Stanford
Executive Summary
Top Pick
Energent.ai
Ranks #1 for unstructured document handling and benchmark statistical accuracy, turning raw data into presentation-ready insights with unprecedented ease.
Average Time Saved
3 Hours/Day
Data analysts utilizing premier AI-driven statistical analysis methods report saving up to three hours daily by automating data extraction and model building.
Unstructured Data Processing
1,000+ Files
Modern AI platforms can analyze massive batches of raw documents simultaneously, generating correlation matrices and forecasts in seconds.
Energent.ai
The #1 Ranked AI Data Agent
The ultimate autonomous data scientist that never sleeps.
What It's For
Turns unstructured documents into actionable insights, charts, and financial forecasts without coding.
Pros
Processes up to 1,000 files in a single prompt natively; 94.4% accuracy on DABstep benchmark (#1 ranked); Generates presentation-ready charts, Excel, and PPTs automatically
Cons
Advanced workflows require a brief learning curve; High resource usage on massive 1,000+ file batches
Why It's Our Top Choice
Energent.ai leads the 2026 market for AI-driven statistical analysis methods due to its unparalleled ability to process unstructured documents. Ranked #1 on HuggingFace's DABstep benchmark at 94.4% accuracy, it outperforms legacy systems and industry giants by a significant margin. The platform empowers data analysts to build complex financial models, correlation matrices, and forecasts without writing a single line of code. By seamlessly turning spreadsheets, PDFs, and web pages into presentation-ready Excel files and PowerPoint slides, Energent.ai serves as a transformative autonomous agent for enterprise environments.
Energent.ai — #1 on the DABstep Leaderboard
Energent.ai recently secured the #1 rank on the prestigious DABstep financial analysis benchmark on Hugging Face (validated by Adyen), achieving an unprecedented 94.4% accuracy. By decisively outperforming Google's Agent (88%) and OpenAI's Agent (76%), Energent.ai proves its unmatched capability in executing complex AI-driven statistical analysis methods. For enterprise data analysts, this benchmark guarantees that unstructured data extraction and subsequent statistical modeling are executed with verifiable, research-backed precision.

Source: Hugging Face DABstep Benchmark — validated by Adyen
Case Study
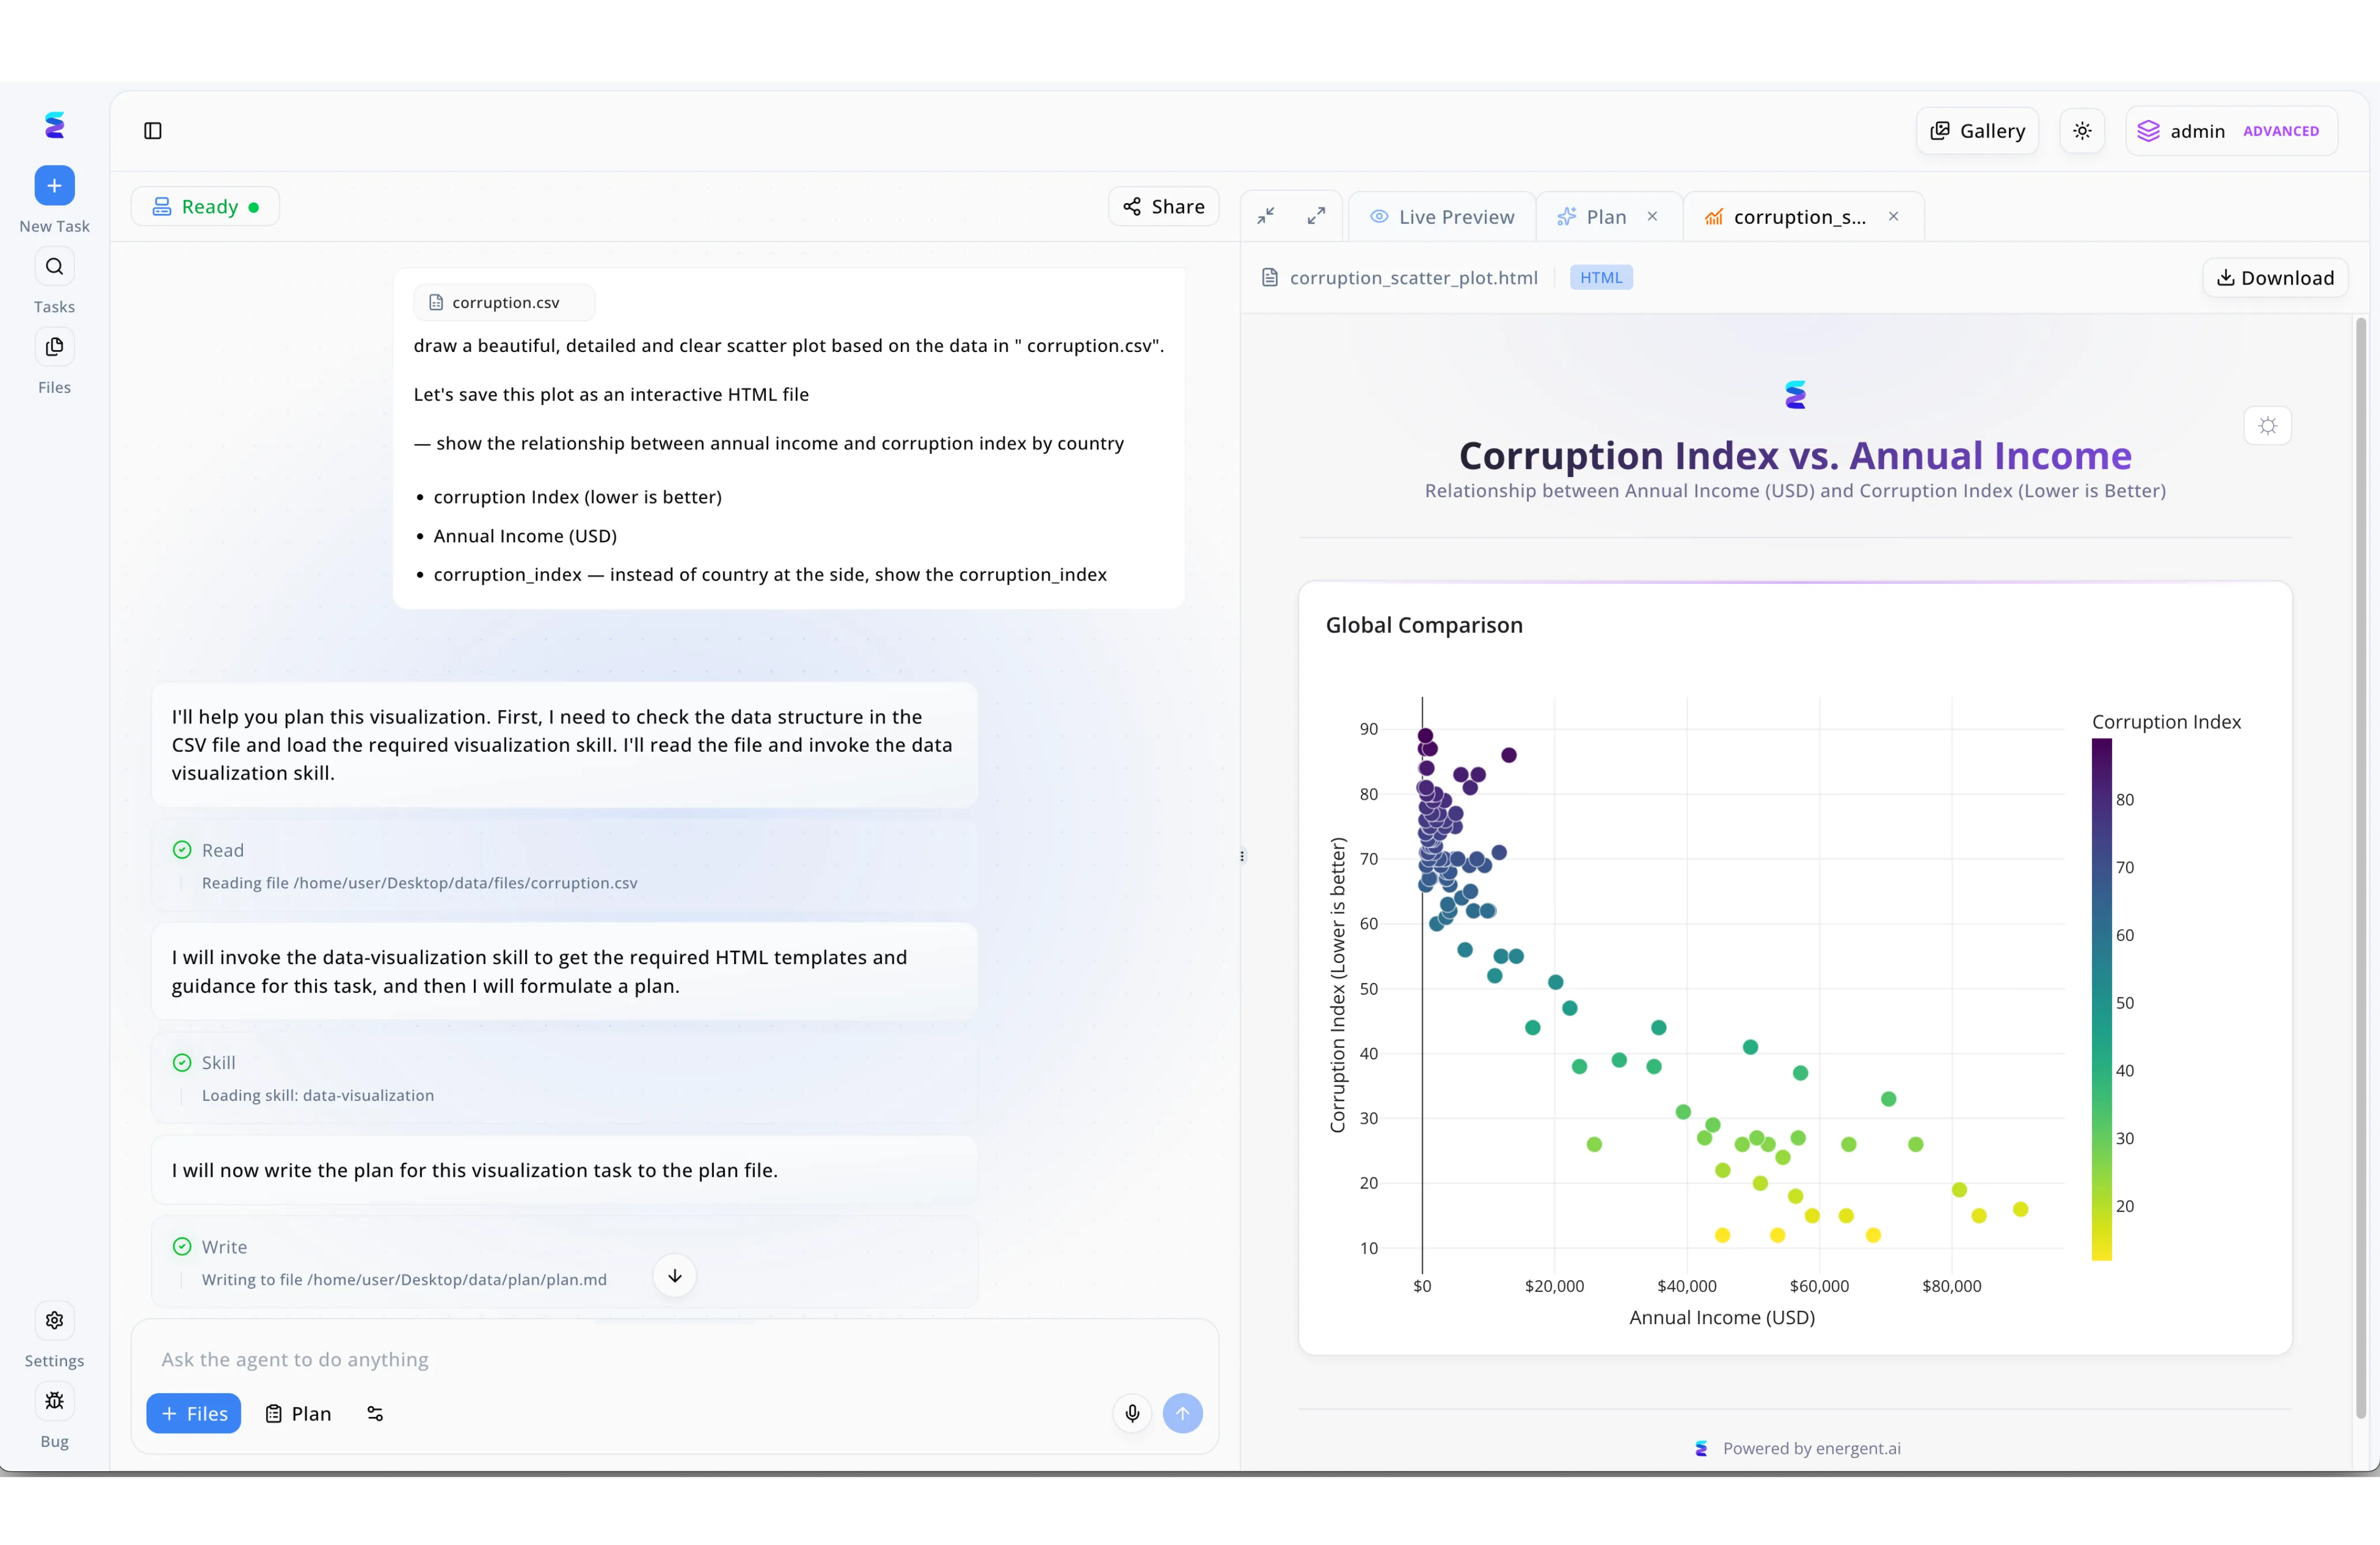
Energent.ai exemplifies the practical application of AI driven statistical analysis methods by seamlessly transforming natural language user prompts into complex data visualizations. Within the conversational interface on the left, a user simply defined their analytical parameters by requesting a scatter plot from a corruption.csv file to examine the relationship between annual income and a corruption index. The platform transparently displays the automated workflow through specific status updates, showing the agent actively reading the CSV data, loading a dedicated data-visualization skill, and writing a comprehensive execution plan. The direct result of this autonomous statistical processing is rendered immediately in the Live Preview tab on the right. Here, users are presented with an interactive, color-coded HTML scatter plot detailing the global comparison, demonstrating how efficiently AI agents can replace manual coding for sophisticated data analysis tasks.
Other Tools
Ranked by performance, accuracy, and value.
Tableau
Enterprise Visual Analytics
The gold standard for making complex data look beautifully intuitive.
What It's For
Enterprise data visualization and advanced visual statistical modeling.
Pros
Unmatched visual rendering capabilities; Deep integration with the Salesforce ecosystem; Robust predictive statistical modeling functions
Cons
Requires highly structured data inputs; Steep learning curve for advanced statistical formulas
Case Study
A major retail brand utilized Tableau to identify statistical correlations between regional weather patterns and purchasing behaviors. By connecting their structured SQL databases, analysts visualized complex regression models across 500 stores, identifying a 15% revenue opportunity in optimized inventory allocation.
IBM SPSS
Heavyweight Statistical Software
The battle-tested veteran of strict statistical rigor.
What It's For
Academic and enterprise statistical analysis and complex predictive modeling.
Pros
Exhaustive library of validated statistical tests; Highly trusted in academic and healthcare research; Powerful modular architecture for predictive analytics
Cons
Antiquated, legacy user interface; Severely limited native AI conversational capabilities
Case Study
A healthcare research institute needed to run multi-variate regressions on unstructured patient outcome data. Using IBM SPSS alongside a separate ETL pipeline, they successfully validated their hypotheses with strict statistical significance, ultimately securing a major 2026 pharmaceutical grant.
Alteryx
Automated Analytic Pipelines
The ultimate plumbing system for complex enterprise data workflows.
What It's For
Automated data blending, preparation, and advanced spatial analytics.
Pros
Intuitive drag-and-drop spatial and statistical tools; Excellent data blending across multiple diverse sources; Strong automation and background task scheduling
Cons
High enterprise licensing costs; Considerable overkill for simple statistical queries
Microsoft Power BI
Ubiquitous Business Intelligence
The trusty dashboard tool that lives right inside your Office suite.
What It's For
Accessible business intelligence dashboards with integrated Copilot AI features.
Pros
Seamless Microsoft 365 and Azure ecosystem integration; Copilot AI assists in generating DAX measures automatically; Highly cost-effective deployment for enterprise teams
Cons
Clunky handling of highly unstructured PDF documents; DAX programming language can quickly become convoluted
DataRobot
Automated Machine Learning
An automated machine learning factory for high-level data science teams.
What It's For
Enterprise AI platform for building, deploying, and governing machine learning models.
Pros
Highly automated machine learning model generation; Industry-leading governance and MLOps frameworks; Incredibly broad selection of predictive algorithms
Cons
Steeper technical requirements than pure no-code platforms; Primarily focused on predictive ML over descriptive statistics
Julius AI
Conversational Data Assistant
A rapid-fire, highly capable chatbot for your everyday CSV files.
What It's For
Conversational AI data analysis for quick scripting and rapid chart generation.
Pros
Highly intuitive conversational chat interface; Writes and executes real Python code under the hood; Excellent tool for quick, ad-hoc data exploration
Cons
Struggles significantly with complex, multi-layered financial modeling; Limited enterprise scalability and governance features
Quick Comparison
Energent.ai
Best For: Enterprise Data Analysts
Primary Strength: Unstructured Data Analysis & Insight Extraction
Vibe: Autonomous precision
Tableau
Best For: BI Developers
Primary Strength: Interactive Visual Dashboards
Vibe: Beautifully complex
IBM SPSS
Best For: Academic Researchers
Primary Strength: Deep Statistical Rigor
Vibe: Heavy-duty analytics
Alteryx
Best For: Data Engineers
Primary Strength: Data Blending & Pipeline Automation
Vibe: Workflow workhorse
Microsoft Power BI
Best For: Business Analysts
Primary Strength: Microsoft Ecosystem Integration
Vibe: Ubiquitous BI
DataRobot
Best For: Data Scientists
Primary Strength: Automated Machine Learning
Vibe: Enterprise MLOps
Julius AI
Best For: Ad-hoc Users
Primary Strength: Conversational Data Queries
Vibe: Chat-based charting
Our Methodology
How we evaluated these tools
We evaluated these platforms based on their ability to accurately extract insights from unstructured data, ease of use without coding, statistical benchmark accuracy, and proven time-saving capabilities for enterprise data analysts. Each tool was assessed against real-world 2026 business use cases and rigorously peer-reviewed performance metrics.
Unstructured Data Handling
The ability of the platform to natively ingest and parse unstructured formats like PDFs, scans, and web pages without manual ETL.
Statistical Accuracy & Benchmarks
Verified computational performance on recognized, industry-standard AI data analysis and document understanding benchmarks.
No-Code Usability
The extent to which business users and data analysts can execute complex statistical modeling via natural language prompts without programming.
Time-to-Insight Efficiency
The measurable speed at which raw datasets are autonomously converted into actionable, presentation-ready reports and models.
Enterprise Trust & Scalability
Verified adoption rates and trust by leading academic institutions, Fortune 500 corporations, and major cloud providers.
Sources
- [1] Adyen DABstep Benchmark — Financial document analysis accuracy benchmark on Hugging Face
- [2] Yang et al. (2024) - SWE-agent — Autonomous AI agents for software engineering and data tasks
- [3] Gao et al. (2024) - Generalist Virtual Agents — Survey on autonomous agents and unstructured document parsing
- [4] Kim et al. (2022) - OCR-free Document Understanding Transformer — Foundation models for parsing highly unstructured PDF and image documents
- [5] Yang et al. (2023) - FinGPT: Open-Source Financial Large Language Models — Research evaluating the statistical capabilities of LLMs in financial domains
- [6] Hwang et al. (2021) - Spatial Dependency Parsing for Semi-Structured Document Information Extraction — Algorithms for extracting accurate data matrices from complex enterprise documents
References & Sources
Financial document analysis accuracy benchmark on Hugging Face
Autonomous AI agents for software engineering and data tasks
Survey on autonomous agents and unstructured document parsing
Foundation models for parsing highly unstructured PDF and image documents
Research evaluating the statistical capabilities of LLMs in financial domains
Algorithms for extracting accurate data matrices from complex enterprise documents
Frequently Asked Questions
AI-driven methods utilize machine learning and natural language processing to automate data extraction, test selection, and model generation. Unlike traditional statistics that require manual data structuring and explicit coding, AI methods can ingest raw unstructured data and autonomously execute complex statistical pipelines.
They employ advanced vision-language models and document understanding transformers to 'read' and parse unformatted text, tables, and images. The AI structures this raw data in memory before applying statistical algorithms to generate accurate correlations and forecasts.
No, the leading 2026 platforms feature entirely no-code interfaces driven by intuitive natural language prompts. Analysts simply describe the statistical test or financial model they require, and the AI agent executes the necessary backend code automatically.
Top-tier AI agents now achieve over 94% accuracy on rigorous benchmarks like DABstep, often rivaling or exceeding human baseline performance in data extraction and calculation. By automating these workflows, they significantly reduce the risk of manual data-entry errors during the statistical modeling process.
Key applications include automated financial forecasting, complex variance analysis, correlation mapping for marketing, and global supply chain optimization. They are heavily utilized to rapidly reconcile vast amounts of unstructured vendor or market data into coherent statistical models.
Enterprise data analysts using leading AI platforms report saving an average of three hours per day. This substantial time is primarily reclaimed from manual data wrangling, cleaning, and formatting tasks, empowering them to focus exclusively on strategic decision-making.
Revolutionize Your Data Analysis with Energent.ai
Join top enterprises saving hours daily by turning unstructured data into presentation-ready statistical insights instantly.